So First Off, What is an Outlier?
An outlier is any piece of data that is at abnormal distance from other points in the dataset. To us humans looking at few values at guessing outliers is easy.
Take a look at this, Can you guess which are outliers?
[25, 26, 38, 34, 3, 33, 23, 85, 70, 28, 27]
Well my friend, here, 3, 70, 85 are outliers.
But consider this, as a Data Scientist, we might have to analyze hundreds of columns containing thousands or even millions of values. And you will immediately come to the conclusion that this method of guessing is just not feasible.
A box plot like this one might come handy, but not sufficient.

Here come Statistics to the Rescue
There are two methods which I am going to discuss:
- One using Interquartile Ranges.
- Second using Standard deviation. More on that later.
1. Removing Outliers using Interquartile Range or IQR
So, before we understand this method of removing outliers, my friend we first need to understand Percentiles.
What is Percentiles?
A percentile indicates the value below which a given percentage of observations in a group of observations fall.
Think of sorting data set containing 100 values and dividing it in 100 equal parts, now the value at any place, say at 10th is our 10th percentile, i.e. value at index 10 indicates below which 10% of values fall.
And you might have seen these values already. Where? In a DataFrame’s describe method.

Once you have understood percentiles, it’s easy-peasy to understand IQR and determine the thresholds. How? Let’s first go over IQR first.
What is Interquartile ranges or IQR?
The IQR describes the middle 50% of values when ordered from lowest to highest.
The IQR is then the difference between Third quartile and First quartile.
\[\text{IQR} = Q_3 - Q_1\]
Or in other words the bulk of values. To determine IQR we need to get Third quartile and first quartile.
Now, What is Quartiles?
Likewise percentile, a quartile instead cuts the data in 4 equal parts. Hence, 25th percentile is our first quartile, 50th percentile is second quartile, 75th percentile is our third quartile.
Good thing is, to calculate quartiles is not that difficult.
def determine_outlier_thresholds_iqr(dataframe, col_name, th1=0.25, th3=0.75):
    quartile1 = dataframe[col_name].quantile(th1)
    quartile3 = dataframe[col_name].quantile(th3)
    iqr = quartile3 - quartile1
    upper_limit = quartile3 + 1.5 * iqr
    lower_limit = quartile1 - 1.5 * iqr
    return lower_limit, upper_limit
Here, I have calculated the the lower limit and upper limit to calculate the thresholds. Often you will see the th1 and the th3 being replaced with 0.05 and 0.95 to trim down the amount of data that is seen as outliers.
Now back to detecting outliers, We now have lower limit, upper limit as well as understood IQR and quartile.
So far we followed these steps:
- Calculated First and Third quartiles.
- Using those quartiles calulated IQR.
- Then using IQR calculated limits for our values to lie in between.
Next, we are just going to check for outliers per column and replace them with limit in replace_with_thresholds_iqr().
def check_outliers_iqr(dataframe, col_name):
    lower_limit, upper_limit = determine_outlier_thresholds_iqr(dataframe, col_name)
    if dataframe[(dataframe[col_name] > upper_limit) | (dataframe[col_name] < lower_limit)].any(axis=None):
        return True
    else:
        return False

def replace_with_thresholds_iqr(dataframe,cols, th1=0.05, th3=0.95, replace=False):
    from tabulate import tabulate
    data = []
    for col_name in cols:
        if col_name != 'Outcome':
            outliers_ = check_outliers_iqr(df,col_name)
            count = None
            lower_limit, upper_limit = determine_outlier_thresholds_iqr(dataframe, col_name, th1, th3)
            if outliers_:
                count = dataframe[(dataframe[col_name] > upper_limit) | (dataframe[col_name] < lower_limit)][col].count()
                if replace:
                    if lower_limit < 0:
                        # We don't want to replace with negative values, right!
                        dataframe.loc[(dataframe[col_name] > upper_limit), col_name] = upper_limit
                    else:
                        dataframe.loc[(dataframe[col_name] < lower_limit), col_name] = lower_limit
                        dataframe.loc[(dataframe[col_name] > upper_limit), col_name] = upper_limit
            outliers_status = check_outliers_iqr(df, col_name)
            data.append([outliers_, outliers_status, count, col_name, lower_limit, upper_limit ])
    table = tabulate(data, headers=['Outliers (Previously)', 'Outliers', 'Count', 'Column', 'Lower Limit', 'Upper Limit'], tablefmt='rst', numalign='right')
    print("Removing Outliers using IQR")
    print(table)

replace_with_thresholds_iqr(df, df.columns)
Often lower limit could be negative and we don’t want to replace with negative values certain times like “age” or “speed”. I wrote this function to do a lot more than that, like first checking for outliers and reporting count, and replace oncereplace = True is passed, and print a nice table.

Perform a check, once you are satisfied, then pass replace=True. And we are Done!
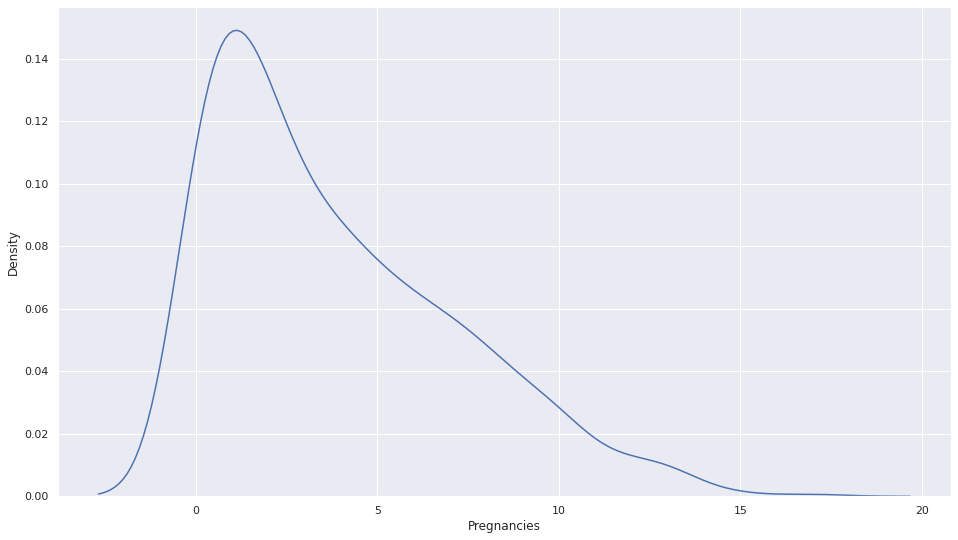
This method is best suitable when you have data that is skewed (either right or left), like in this dataset which I am using to demonstrate, one column is right skewed.

2. Removing Outliers using Standard Deviation.
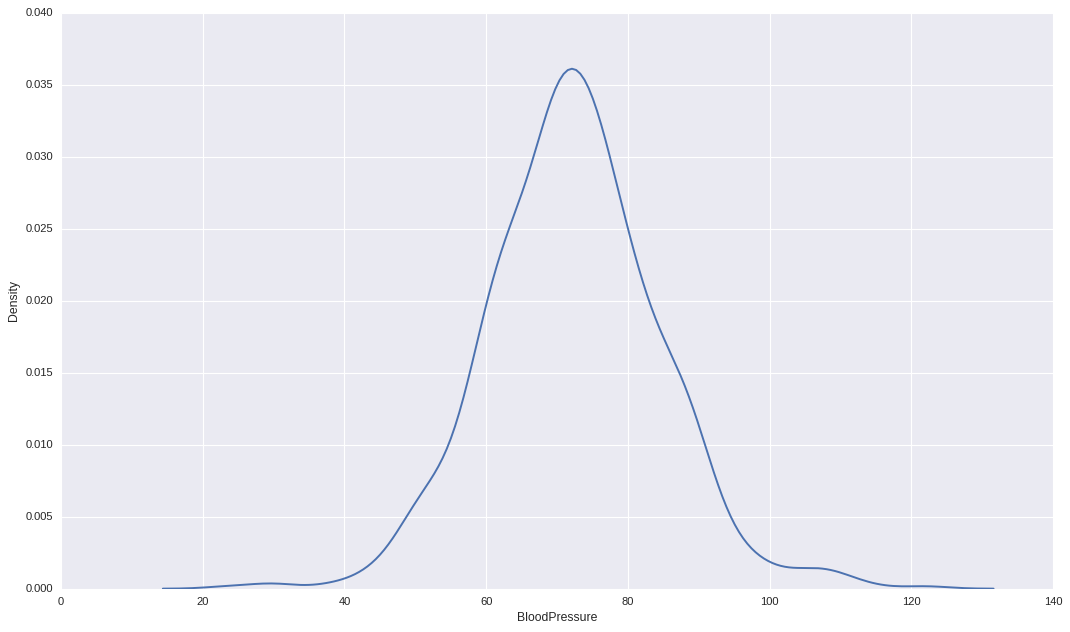
Another way we can remove outliers is by calculating upper boundary and lower boundary by taking 3 standard deviation from the mean of the values (assuming the data is Normally/Gaussian distributed).
Like in this case,

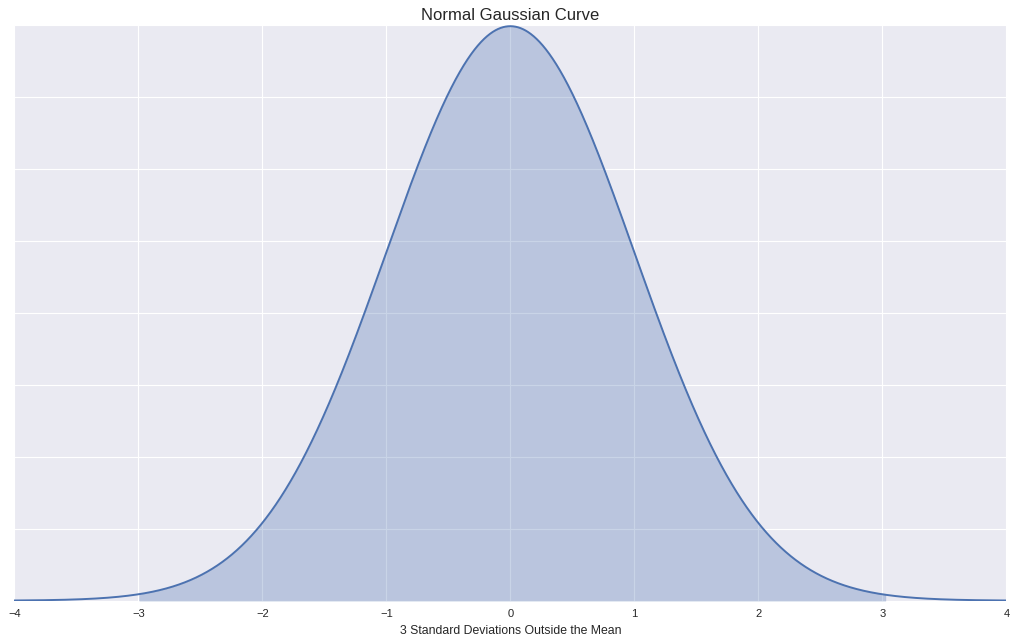
And we are are going to exploit one special property of Normal Distribution.
Normal distribution has the property that,
- 68% of the data falls within one standard deviation of the mean.
- 95% of the data falls within two standard deviations of the mean.
- 99.7% of the data falls within three standard deviations of the mean.

Using this property we can expect to have 99.7% of the values to be normal if taking 3rd Standard Deviation (Or you can use 2nd Standard Deviation increasing the expected outliers.).
def determine_outlier_thresholds_std(dataframe, col_name):
    upper_boundary = dataframe[col_name].mean() + 3 * dataframe[col_name].std()
    lower_boundary = dataframe[col_name].mean() - 3 * dataframe[col_name].std()
    return lower_boundary, upper_boundary
Here, I just created upper and lower boundary by adding and subtracting 3 Standard Deviation from mean.
Using this we can now remove outliers just like before. But now remember to call this new function.
def check_outliers_std(dataframe, col_name):
    lower_boundary, upper_boundary = determine_outlier_thresholds_std(dataframe, col_name)
    if dataframe[(dataframe[col_name] > upper_boundary) | (dataframe[col_name] < lower_boundary)].any(axis=None):
        return True
    else:
        return False

def replace_with_thresholds_std(dataframe, cols, replace=False):
    from tabulate import tabulate
    data = []
    for col_name in cols:
        if col_name != 'Outcome':
            outliers_ = check_outliers_std(dataframe, col_name)
            count = None
            lower_limit, upper_limit = determine_outlier_thresholds_std(dataframe, col_name)
            if outliers_:
                count = dataframe[(dataframe[col_name] > upper_limit) | (dataframe[col_name] < lower_limit)][col_name].count()
                if replace:
                    if lower_limit < 0:
                        # We don't want to replace with negative values, right!
                        dataframe.loc[(dataframe[col_name] > upper_limit), col_name] = upper_limit
                    else:
                        dataframe.loc[(dataframe[col_name] < lower_limit), col_name] = lower_limit
                        dataframe.loc[(dataframe[col_name] > upper_limit), col_name] = upper_limit
            outliers_status = check_outliers_std(dataframe, col_name)
            data.append([outliers_, outliers_status,count, col_name, lower_limit, upper_limit])
    table = tabulate(data, headers=['Outlier (Previously)','Outliers','Count', 'Column','Lower Limit', 'Upper Limit'], tablefmt='rst', numalign='right')
    print("Removing Outliers using 3 Standard Deviation")
    print(table)

replace_with_thresholds_std(df, df.columns,replace=False)
Just like before once we are satisfied pass replace=True and the outliers will be gone.
Note: In both the examples I have passed all the columns which isn’t always required/suitable.
Which one should I choose?
Ideally, IQR method is best suited for datasets which are skewed (either left or right)( you can check if they are skewed or not by plotting histograms or the kernel Density Estimation plot). But you do need to keep a check on the extreme values, by checking lower and upper limit.
Otherwise as stated use the Standard Deviations to detect outliers when the data is Normally distributed (which is quite often).


